INSIGHT EXPENSE TRACKER
Professional expense management platform built for precision and clarity in financial oversight.
Insight is a comprehensive expense tracking application designed to help individuals and professionals manage their finances with advanced analytics, detailed reporting, and intuitive user experience.
KEY FEATURES
QUICK START GUIDE
Get up and running with Insight in just a few minutes.
STEP 1: INITIAL SETUP
- Access the dashboard by clicking "ACCESS DASHBOARD" from the homepage
- Navigate to Settings to configure your preferences:
- Set your preferred currency
- Configure date format and timezone
- Set up monthly income and expense budgets
STEP 2: ADD YOUR FIRST TRANSACTION
- Go to the Transactions section
- Fill out the "Add New Transaction" form:
- Enter a description
- Set the amount
- Choose transaction type (Income/Expense)
- Select appropriate category
- Set the date
- Choose payment method
- Click "Add Transaction" to save
STEP 3: EXPLORE YOUR DATA
- Return to Dashboard to see your financial overview
- Check the Analytics section for spending patterns
- Generate reports for detailed insights
INSTALLATION
Insight is a web-based application that requires no installation.
SYSTEM REQUIREMENTS
- Modern web browser (Chrome, Firefox, Safari, Edge)
- Internet connection
- JavaScript enabled
BROWSER COMPATIBILITY
| Browser | Minimum Version | Status |
|---|---|---|
| Chrome | 80+ | ✅ Fully Supported |
| Firefox | 75+ | ✅ Fully Supported |
| Safari | 13+ | ✅ Fully Supported |
| Edge | 80+ | ✅ Fully Supported |
MOBILE SUPPORT
Insight is fully responsive and works seamlessly on mobile devices and tablets. The interface automatically adapts to your screen size for optimal user experience.
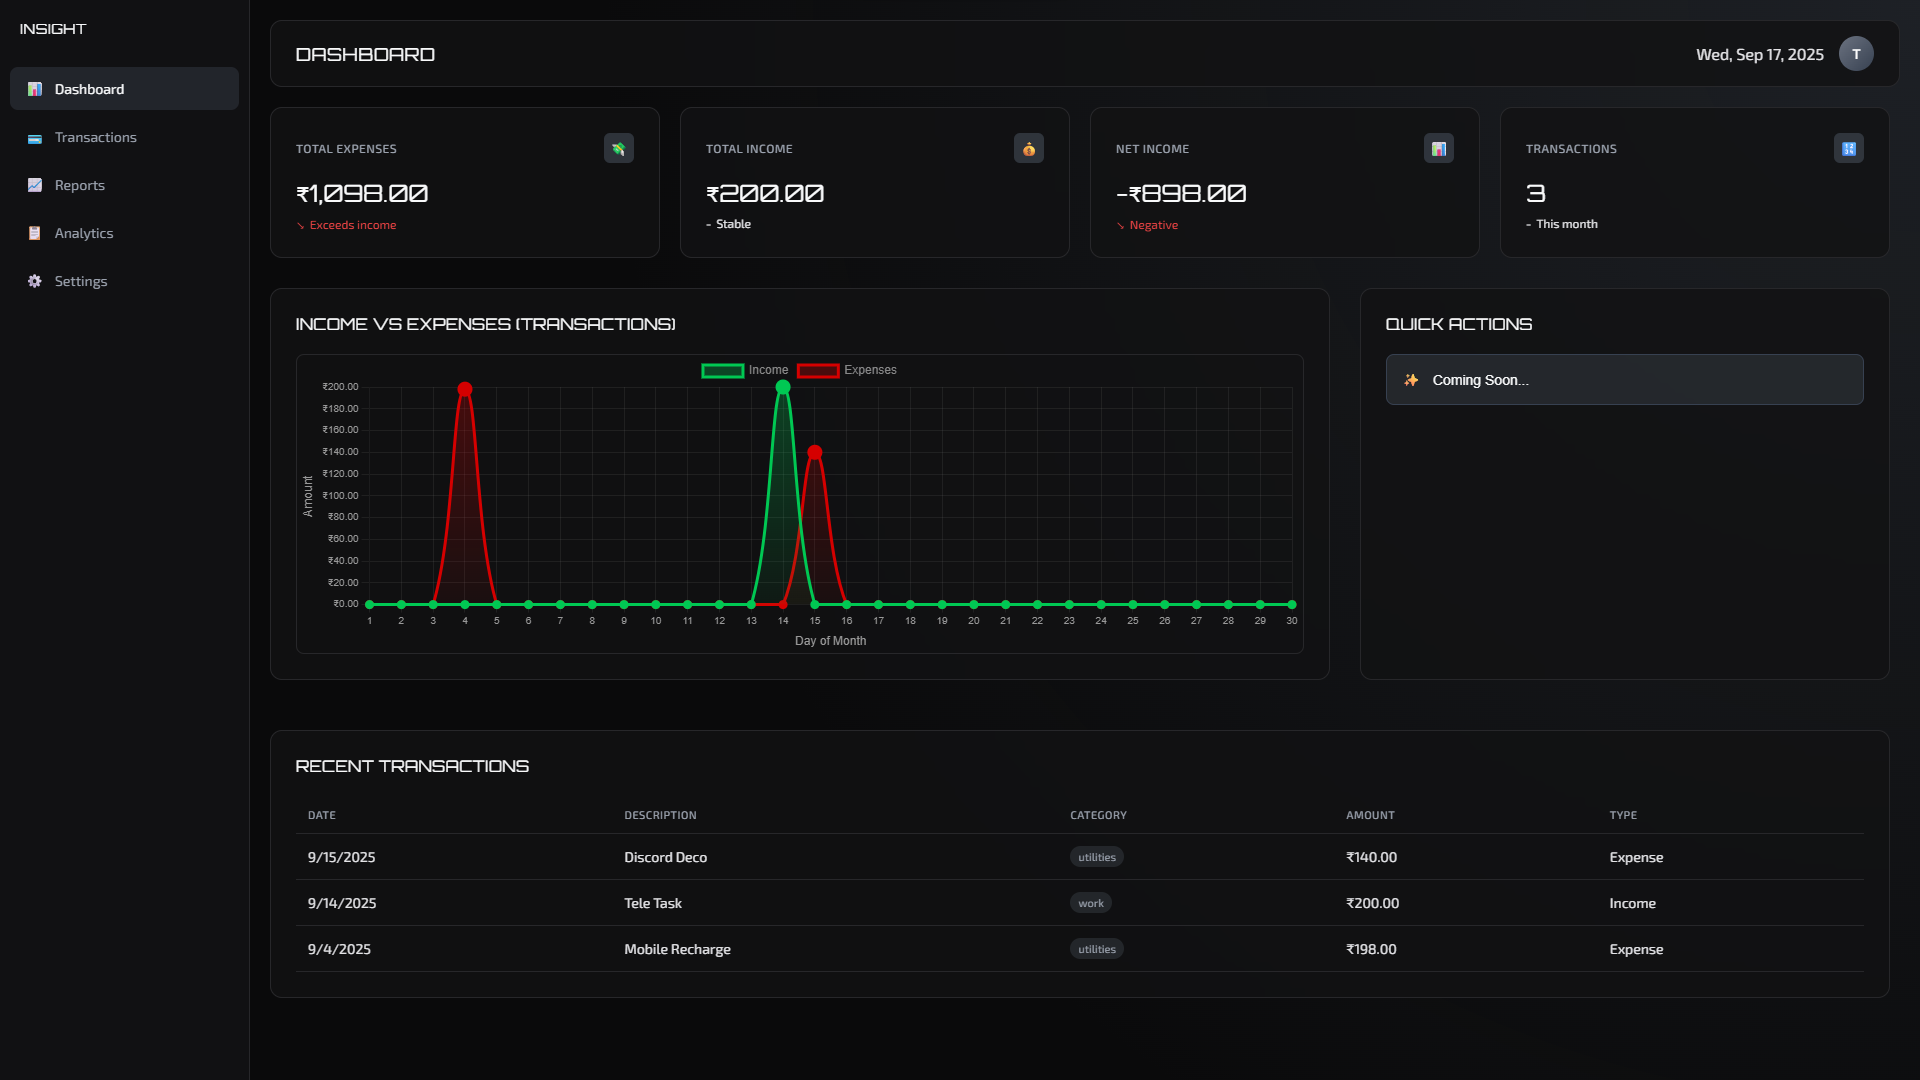
DASHBOARD
Your central hub for financial overview and quick insights.
OVERVIEW STATS
The dashboard provides four key metrics at the top:
- Total Expenses: Sum of all expense transactions
- Total Income: Sum of all income transactions
- Net Income: Difference between income and expenses
- Transactions: Total number of transactions this month
INCOME VS EXPENSES CHART
Interactive chart displaying the relationship between your income and expenses over time. This visualization helps identify spending patterns and financial trends.
RECENT TRANSACTIONS
Quick access to your most recent transactions with key details:
- Date
- Description
- Category
- Amount
- Transaction type
TRANSACTIONS
Comprehensive transaction management with advanced filtering and search capabilities.
ADDING TRANSACTIONS
The transaction form includes the following fields:
| Field | Required | Description |
|---|---|---|
| Description | Yes | Brief description of the transaction |
| Amount | Yes | Transaction amount (positive number) |
| Type | Yes | Income or Expense |
| Category | Yes | Predefined categories for organization |
| Date | Yes | Transaction date |
| Payment Method | No | Cash, Card, Bank Transfer, Digital Wallet |
| Notes | No | Additional information |
CATEGORIES
Available transaction categories:
- Food
- Transport
- Shopping
- Entertainment
- Utilities
- Healthcare
- Housing
- Education
- Work
- Other
FILTERING AND SEARCH
Use the search and filter tools to find specific transactions:
- Search: Find transactions by description
- Type Filter: Show only income, expenses, or all transactions
- Refresh: Reload transaction data
REPORTS
Generate detailed financial reports with custom date ranges and export options.
REPORT TYPES
GENERATING REPORTS
- Select the report type from the dropdown
- Choose start and end dates for the reporting period
- Click "Generate Report" to create the report
- Review results in the Report Results section
EXPORT OPTIONS
Reports can be exported in multiple formats:
- CSV: Spreadsheet-compatible format for further analysis
- JSON: Machine-readable format for integration with other tools
ANALYTICS
Advanced spending analysis with interactive charts and trend visualization.
SPENDING ANALYTICS
The analytics section provides key metrics for different time periods:
- Last Week: Recent spending patterns
- Last Month: Monthly financial overview
- Last Year: Annual trends and patterns
KEY METRICS
| Metric | Description | Calculation |
|---|---|---|
| Average Daily Spending | Daily spending average for the selected period | Total expenses ÷ number of days |
| Highest Expense | Largest single expense transaction | Maximum expense amount |
| Most Used Category | Category with the most transactions | Category frequency analysis |
| Savings Rate | Percentage of income saved | (Income - Expenses) ÷ Income × 100 |
CATEGORY BREAKDOWN
Visual representation of spending distribution across different categories, helping identify areas for budget optimization.
SPENDING TRENDS
Interactive chart showing spending patterns over time, enabling you to:
- Identify seasonal spending patterns
- Track progress toward financial goals
- Spot unusual spending spikes
- Monitor budget adherence
SETTINGS
Customize your Insight experience with personalized preferences and financial goals.
ACCOUNT SETTINGS
| Setting | Options | Default |
|---|---|---|
| Currency | USD, EUR, GBP, JPY, CAD, AUD, INR | USD |
| Date Format | MM/DD/YYYY, DD/MM/YYYY, YYYY-MM-DD | MM/DD/YYYY |
| Theme | Dark | Dark |
| Timezone | Various global timezones | UTC |
MONTHLY FINANCIAL PLANNING
Set up your monthly financial framework for better tracking and goal achievement:
Monthly Incomes
- Pocket Money: Regular allowance or pocket money
- Salary: Employment income
- Others: Additional income sources
Monthly Expenses
- House Rent and/or WIFI: Housing and internet costs
- Online/Offline Subscriptions: Recurring service payments
- Others: Additional fixed expenses
Monthly Goals
- Target Savings: Amount you aim to save monthly
- Target Investment: Monthly investment goals
- Others: Additional financial objectives
NOTIFICATIONS
- Email Notifications: Receive updates via email
- Budget Alerts: Get notified when approaching budget limits
API REFERENCE
Technical documentation for developers and advanced users.
FUTURE API ENDPOINTS
Planned endpoints for the upcoming API release:
Authentication
Transactions
Reports
Analytics
TROUBLESHOOTING
Common issues and their solutions.
COMMON ISSUES
Transactions Not Saving
Problem: Transaction form submits but data doesn't appear in the list.
Solution:
- Ensure all required fields are filled
- Check that the amount is a valid positive number
- Refresh the page and try again
- Clear browser cache and cookies
Charts Not Loading
Problem: Charts appear blank or don't load properly.
Solution:
- Ensure JavaScript is enabled in your browser
- Add at least 2-3 transactions to populate charts
- Try refreshing the page
- Check browser console for error messages
Reports Not Generating
Problem: Report generation fails or shows no data.
Solution:
- Verify date range includes existing transactions
- Ensure start date is before end date
- Check that you have transactions in the selected period
Data Not Persisting
Problem: Data disappears after refreshing the page.
Solution:
- Ensure cookies are enabled for the site
- Check browser storage permissions
- Try using a different browser
- Disable private/incognito mode
BROWSER-SPECIFIC ISSUES
Safari on iOS
- Enable "Prevent Cross-Site Tracking" if experiencing storage issues
- Clear Safari data if charts don't render
Firefox
- Check Enhanced Tracking Protection settings
- Ensure local storage is not disabled
FREQUENTLY ASKED QUESTIONS
Answers to common questions about Insight.
GENERAL QUESTIONS
Is Insight free to use?
Yes, Insight is completely free to use with all features available at no cost as it's still in development.
Do I need to create an account?
Yes.
Is my financial data secure?
Your data is stored in our database hashed and encrypted. This ensures complete privacy of your financial information.
Can I use Insight on mobile devices?
Yes, Insight is fully responsive and works seamlessly on smartphones and tablets.
FUNCTIONALITY QUESTIONS
Can I edit or delete transactions?
You can delete transactions from the All Transactions table. Edit functionality is planned for future updates.
How many transactions can I store?
No limit.
Can I backup my data?
Use the export functions in the Reports section to download your data as CSV or JSON files for backup purposes.
What currencies are supported?
Insight supports USD, EUR, GBP, JPY, CAD, AUD, and INR. The currency setting affects display formatting only.
TECHNICAL QUESTIONS
What browsers are supported?
Insight supports all modern browsers including Chrome, Firefox, Safari, and Edge (version requirements listed in the Installation section).
Does Insight work offline?
No.
Can I import data from other expense tracking apps?
Currently, manual data entry is required. Import functionality is planned for future releases.